One of the standout features of Home Assistant, setting it apart from other smart home platforms, is its robust ability to log and review the activity within your home. The Home Assistant Energy Dashboard is an integral tool that provides seamless monitoring of various household utilities, including electricity, gas, and water.
In this article, we will delve into the Home Assistant Energy Dashboard, focusing specifically on how to set up basic electricity monitoring at the device level using a simple smart plug. This guide will empower you to gain valuable insights into your home’s energy consumption.
Important Note: Always have electrical devices such as monitoring clamps installed by a licensed professional electrician. The Home Assistant software changes described here are for informational purposes only and are done at your own risk.
Table of contents
The Home Assistant Energy Dashboard
The Energy Dashboard is an essential feature that comes standard when you set up the Home Assistant smart home software.
To monitor your total electricity usage, you’ll need a device such as the Shelly EM. (Ad). However, many car chargers come equipped with a CT clamp, which may already be compatible with Home Assistant. As a reminder, the installation of such devices should always be carried out by a licensed electrician to ensure safety and proper functionality.
The image below showcases a typical monthly overview of an already configured ‘Home Assistant’ home, tracking electricity consumption exclusively.
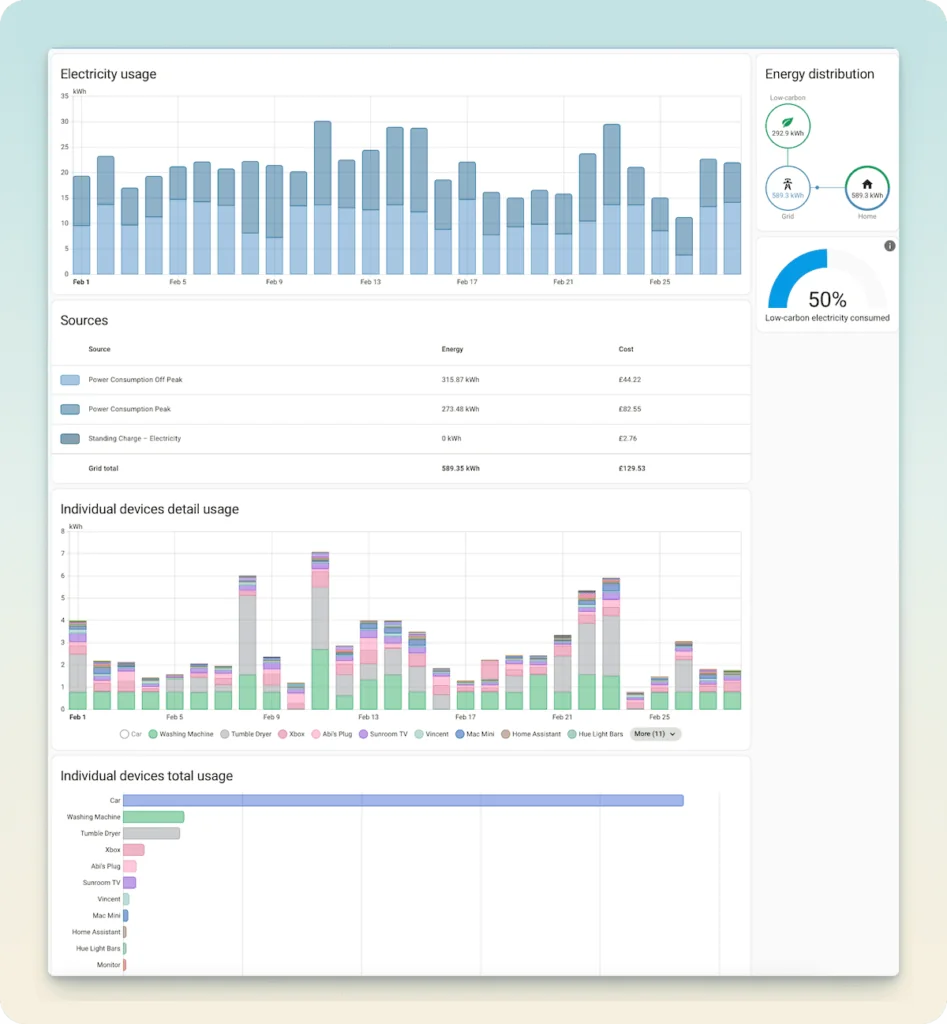
There are four key areas of the Home Assistant Energy dashboard:
- Electricity Usage
- Sources
- Individual Devices Detailed Usage
- Individual Devices Total Usage
Electricity Usage Home Assistant Energy Dashboard
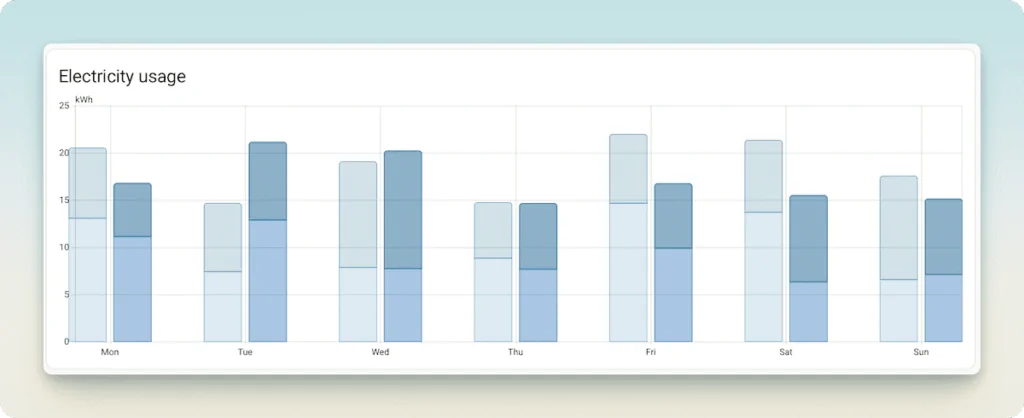
This section tracks the electricity used over a set period. For a day, the units are in hours; for a month, they’re in days, and so on. The graph shows two shades of blue, indicating the energy used by different tariffs, if applicable. More on this later.
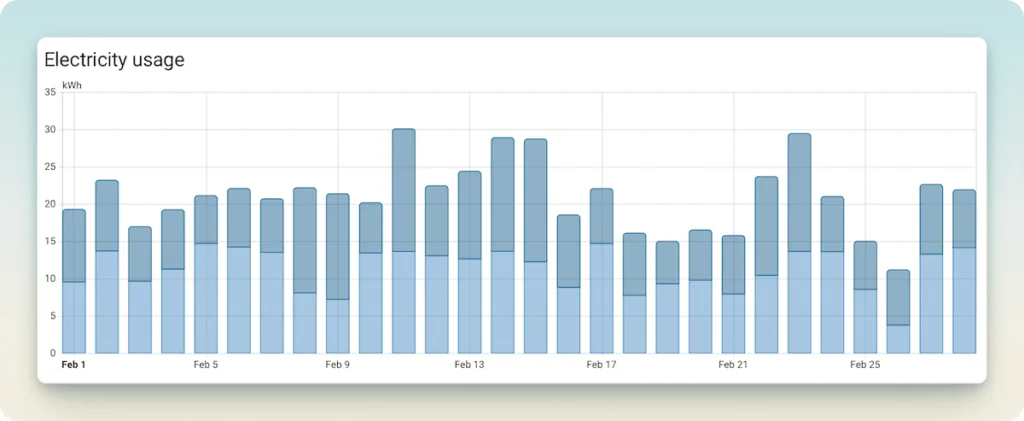
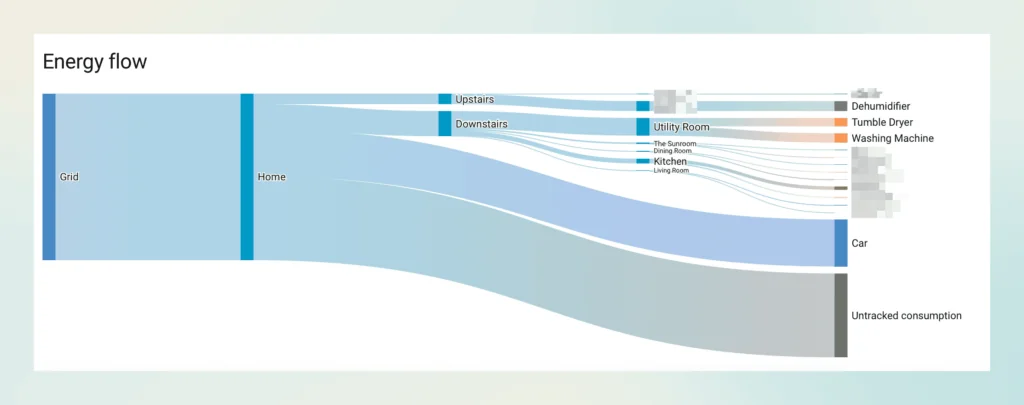
August 2025 saw the introduction of a new Home Assistant Energy flow graph.
Sources
I have three meters set up: one that tracks peak electricity use, one for off-peak, and one custom meter to track the standard charge.

Setting up Tariffs in Home Assistant
To manage two different electricity costs (Peak and Off-Peak), I am using the Utility Meter Integration: Utility Meter Integration. I have three Utility Meters set up as ‘Helpers’. All three were set up as one easy process.
Step 1: Creating Helpers
Create a new Helper (under devices and services) and select Utility Meter, name it something like “Power Consumption”.
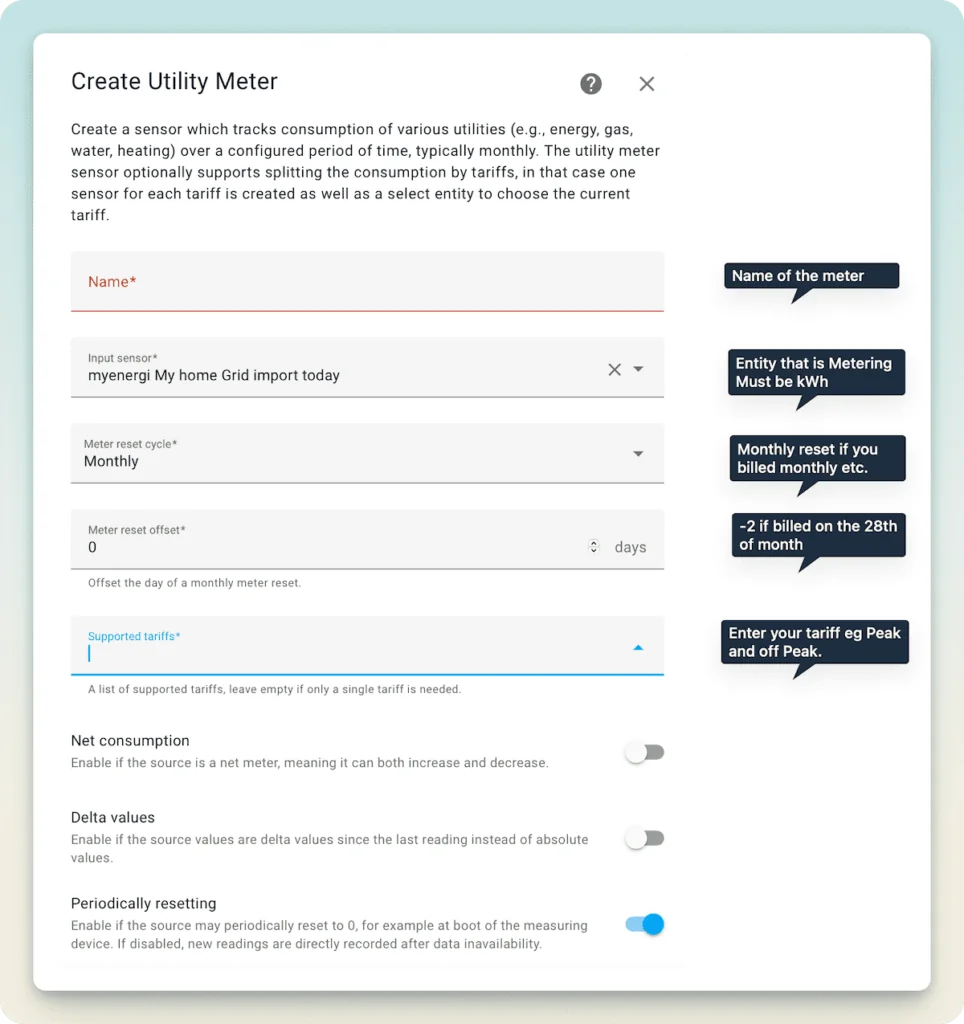
When setting up your monitoring system, it’s essential to select the appropriate entity being monitored. In this case, a traditional clamp meter is the ideal choice. Previously, I used a Shelly EM, (Ad) but with the installation of my MyEnergi Zappi car charger, I switched to this configuration.
The Meter Reset Cycle refers to the frequency at which you’re billed. In my case this is monthly.
The Meter Offset allows for a daily adjustment to align with your specific billing cycle. For instance, if your billing date is the 15th, you can set the offset to ensure proper tracking.
Finally, under Support Tariffs, you’ll enter the specific rate plans your utility provider offers. For my setup, I only need to configure Peak and Off-Peak rates.
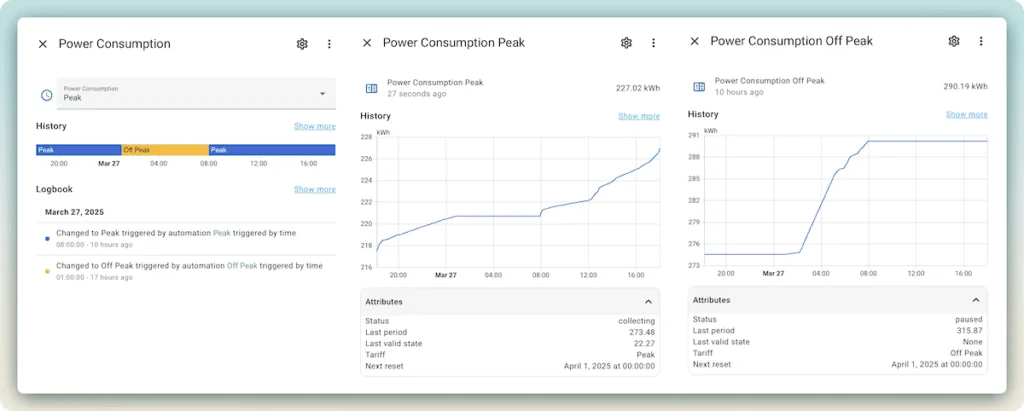
After submitting this information, you will have three utility meters: two sensor meters and one selector meter, all tailored to track your energy usage efficiently.
| Meter | Units | Reset | Type |
|---|---|---|---|
| Power Consumption Peak | kWh | Monthly | Sensor |
| Power Consumption Off Peak | kWh | Monthly | Sensor |
| Power Consumption | N/A | N/A | Select |

The image below displays the three windows corresponding to each of the utility meters. Having been in operation for some time, these windows are populated with up to date data, providing a clear overview of current energy usage.
Step 2: Home Assistant Automations
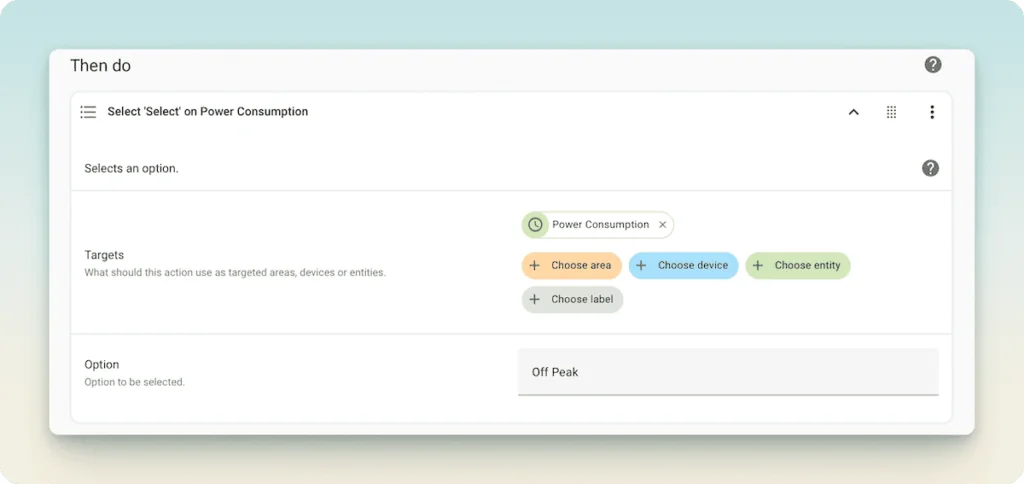
Two automations flip the Power Consumption between Power Consumption Peak and Power Consumption Off Peak. In winter, this is set to 1 AM for off-peak and 8 AM for peak. I then adjust these automations for summer to 2 AM and 9 AM.

Here is a screenshot of one of the automations. At 1 AM, Home Assistant will run a Select-Select on Power Consumption and change it to Off Peak.
Home Assistant Energy Dashboard Settings
In the Energy Dashboard settings, I have added the meters under the Electricity Grid section. This is where you input the unit cost for electricity associated with each tariff. This setup enables Home Assistant to perform accurate cost calculations.
As shown, I have entered the unit cost per kWh into the meter information panel, ensuring precise tracking of energy expenses according to the tariff rate.
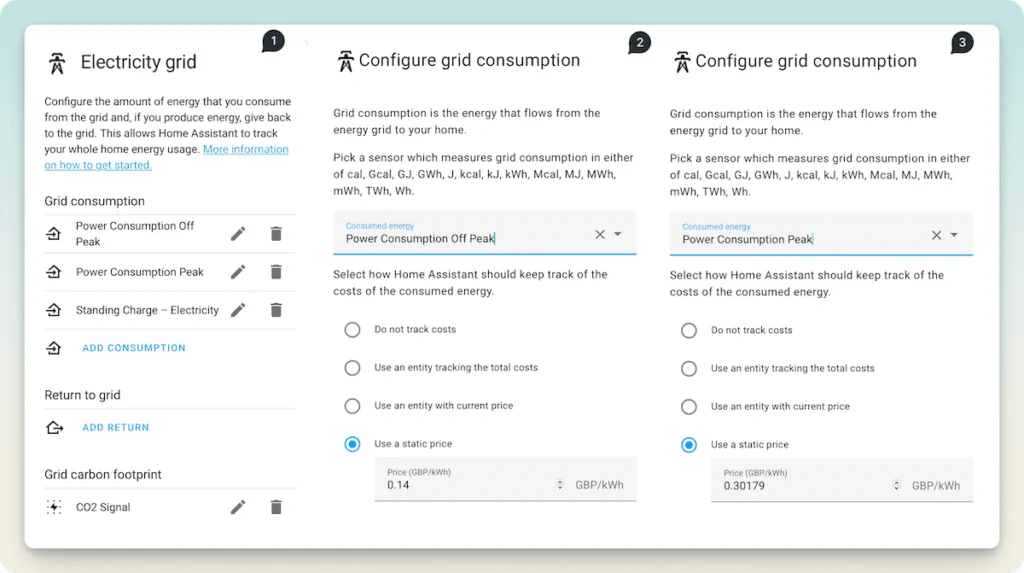
The Energy Dashboard refreshes on the hour, so you may need to wait to check if the system is updating.
Individual Devices Detailed Usage
The true advantage of Home Assistant lies in its ability to visualise electricity usage by individual device. For instance, my car charger offers a comprehensive view, separately reporting both the electricity used for charging the car and the electricity consumed by the home, providing clear insights into each usage category.
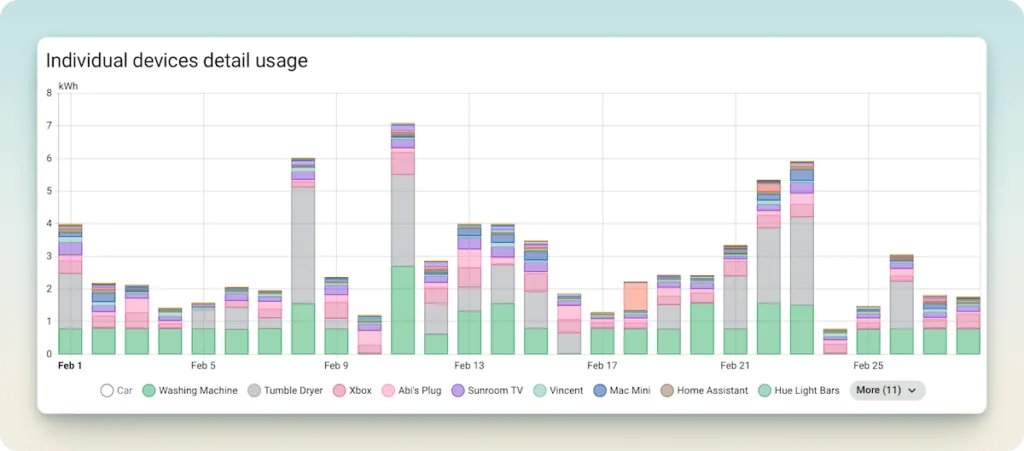
With energy-monitoring smart plugs, I can analyse home electricity usage by device. The following are three energy monitoring smart plugs we use in our home:
These are Amazon affiliate links and support this website. As an Amazon Associate, I earn from qualifying purchases.
How to Add Plugs to the Energy Dashboard
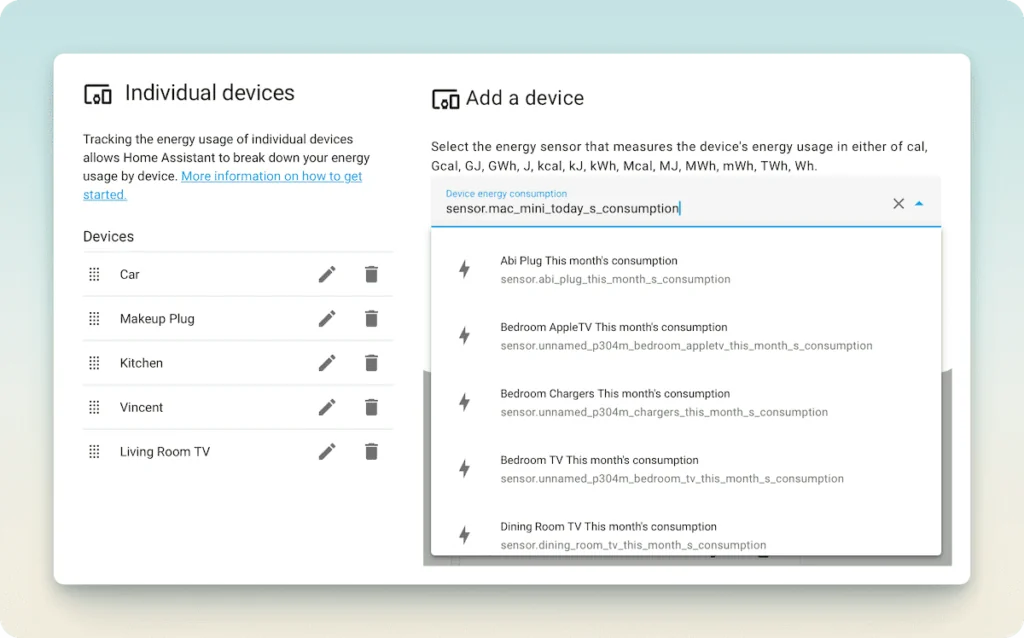
Matter plugs can be added through the Home Assistant Matter Integration. For Tapo (inc Tapo P110M [Ad]) plugs, you can use the dedicated Tapo integration. I found the multi-plug option easier to manage using the TP-Link route.
Once the smart plugs are connected to Home Assistant, adding an energy-monitoring smart plug is very straightforward. See Can Smart Plugs save money.
General Home Assistant Accuracy
Looking at four months of bills, you can see that Home Assistant offers a reasonable picture of energy use. Although my bills are monthly, they run from meter reading to meter reading, so modeling an accurate comparison using cost or kWh isn’t always easy. This is a broad comparison, but I believe Home Assistant gives me a fair idea of my running costs.
Below is a table comparing what Home Assistant calculates as my usage (calendar month) and what my actual bill ended up being (reading to reading):
| Month | Home Assistant | Actual | Diff |
|---|---|---|---|
| November | £126 | £127 | -1 |
| December | £145 | £133 | +12 |
| January | £157 | £170 | -13 |
| February | £129 | £140 | -11 |
| Total | £559 | £570 | -13 |
Upon reviewing the data for December and January, I believe the misalignment stems from the electric company’s request for my reading. Other contributing factors include the accuracy of the clamp meter, though more significant are the network connectivity issues. Whenever I reboot Home Assistant or my network, the data for that period is lost.
That being said, a £13 difference over four months seems reasonable to me. While it’s not perfect, it’s a minimal discrepancy, especially considering the device reboots every time there’s an update.
Electricity Usage Comparisons
One of the most effective ways to track usage is by comparing it to the previous period. Simply click the previous month to add the previous period’s usage to the graph. For example, in the graph below, you can clearly see that the electricity used to charge the car is higher than it was yesterday.
By clicking the comparison button, Home Assistant Energy Dashboard will load comparative data (e.g., day vs. day, week vs. week). The example below shows a week-by-week comparison, and the same comparison can be applied to individual device graphs as well.
Custom Home Assistant Dashboards
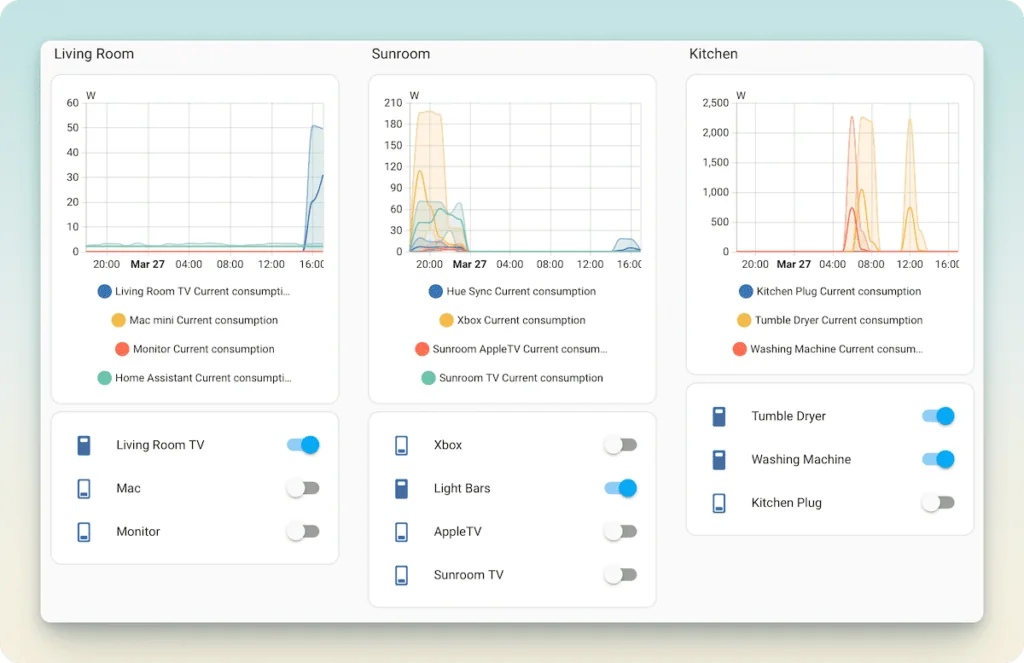
As you become more confident with Home Assistant, you may wish to create custom electricity reporting dashboards. For instance, I have built a dashboard that displays energy usage at the room level, complete with toggle buttons to remotely control the plugs.
This setup allows for easy monitoring and management of energy consumption throughout the home.
Conclusion
I am passionate about data and its potential to drive home efficiency, and Home Assistant offers an outstanding platform for logging, presenting, and analysing home-related data. One of its standout features is the default energy dashboard, a powerful tool for tracking electricity consumption and associated costs.
For those with solar, gas, or water meters, these can also be integrated into the dashboard, providing a comprehensive view of your home’s overall energy usage. If you enjoy data visualisations, the energy dashboard’s intuitive graphs and insights will undoubtedly deepen your understanding of energy trends, helping to optimize your home’s efficiency.
See also – Getting Started with Home Assistant Green.
Home Assistant Energy Dashboard Links:
Recommended Energy Monitoring plugs. All are Matter so compatible with HomeKit, Google Home and Home Assistant. The following are Amazon affiliate links and support this website. As an Amazon Associate, I earn from qualifying purchases.
- Tapo P110M [Ad]
- Tapo P304M (Multiplug) [Ad]
- Eve Energy [Ad}
Please note this guide is followed at your own risk.
Image attribution: Image by photoroyalty on Freepik
Discover more from The Smart Home Blog
Subscribe to get the latest posts sent to your email.


